If you’re creating a true home theater experience, understanding how an SPL graph works can help. SPL, or sound pressure levels, are powerful indicators capable of logging your home theater’s dynamic range. You can download an SPL graph on your smartphone, so you’re never left without recording options. Even if you’re not sending notifications based upon your graph’s readouts, you can take full advantage of your SPL graph’s recordings.
Contents
Understanding the Frequencies
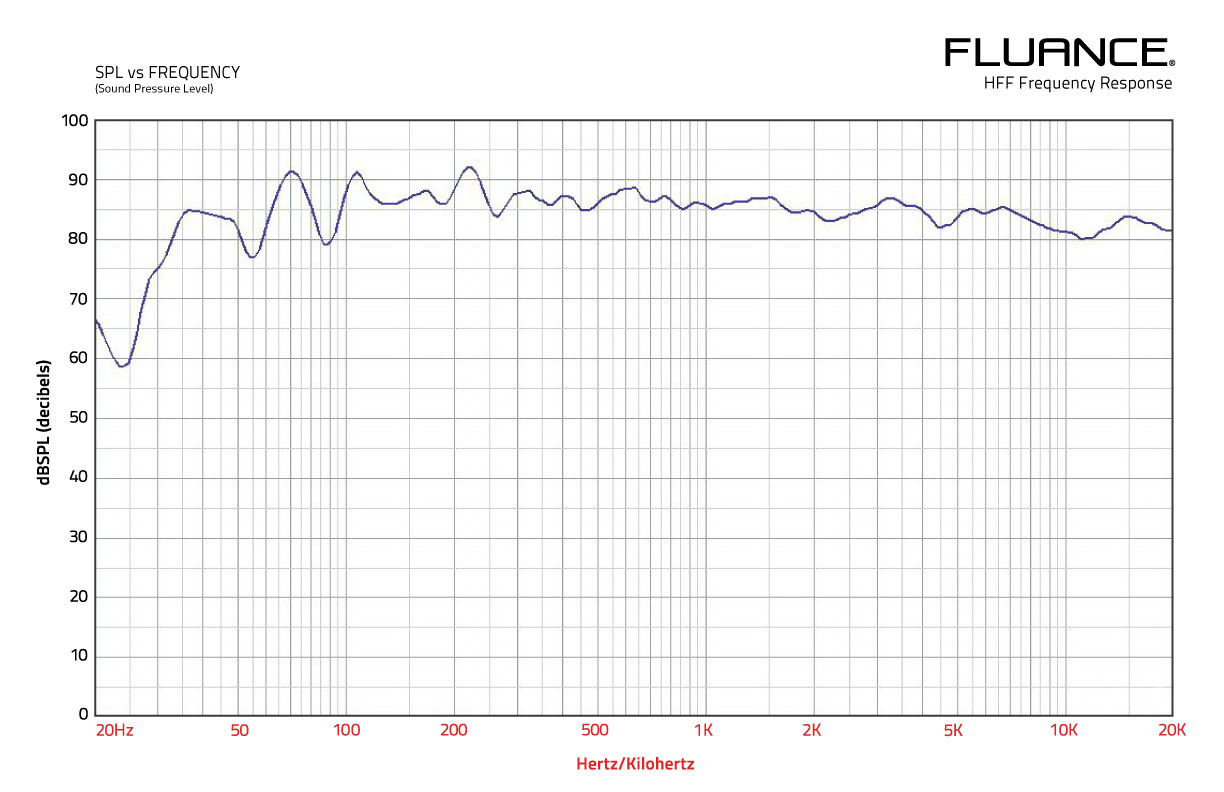
An SPL graph examines the many frequencies existing across your home theater’s audible spectrum. When looking at your graph, you’ll examine the loudness of each frequency. Any piece of equipment trying to produce lifelike sound can be examined with an SPL graph.
In general, you should aim for a flat response curve—or flat graph—as possible. If a graph is completely flat, it means the room, the equipment and every accessory can affect the overall room’s noise. That said, a completely flat graph is almost impossible to obtain. There is distortion in everything. Typically, speakers have a higher degree of dynamic curvature. Meanwhile, solid state amplifiers can be adjusted to produce no distortion.
What’s with the Distortion?
While many people use an SPL graph to reduce distortion, some people might consider it to be an attractive sound quality. In fact, some sound systems create highly parabolic response curves which house high and low-end sounds with low loudness.
Again, however, you should attempt to get as flat of a response curve as possible. In any home theater, it’s possible to find sweet spots with nearly flat curves. If your home theater only has bare walls, you’ll likely identify an effective area which has equidistant walls. These spots have loud peaks when certain frequencies are played. Likewise, they have small peaks at high octaves.
Activating and Using Your SPL Graph
Once you’ve loaded your smartphone’s SPL graph, you’ll be able to see an SPL value. This value can be changed, and you can reset minimum and maximum values. Your SPL graph, likely, can record many hours of sound level data. The graph begins with a one-minute window. Then, it will re-scale—collecting another minute of data.
You can play back the collected audio, viewing the different dB levels as you go. By scrolling, expanding and contracting the time axis, you can view the entire graph. Your graph’s average SPL, which is the overall LEQ, will be computer and shown on your screen. Once you’ve determined the room’s audio levels, you can alter the home theater as needed to aim for a flatter curve.
Saving Data for Later Use
Understandably, you might want to save your room’s recorded sound levels for comparison. If you exit your SPL graph application, your data won’t be lost. Sound data is stored automatically, and you can open it whenever you next activate the program.
Typically, SPL graph apps have a high or unlimited number of saves. You can bring up previous data, listen to any sounds made while the graph was in use and determine “problem areas” impacting your home theater’s noise. If need be, you can store an image of your graph on your smartphone’s photo roll.
Some Considerations
It’s a good idea to understand the range of bass frequencies—which is 20Hz to 500Hz. Any midrange frequencies recorded will be between 500Hz and 5,000Hz. High frequencies exist between 5,000Hz and 20,000Hz. These categories can be divided into smaller subcategories, such as “midbass.”
If you’re familiar with these ranges, you can determine how a speaker should sound when looking at your SPL graph. Similarly, you can determine any oddities existing which might throw off your graph’s baseline. You should take human ear hearing capabilities, too, as well as your home theater’s overall cohesion. Each speaker interacts with another differently, and your home theater’s acoustics can alter each speaker’s overall potential.
An SPL graph is an incredible tool to have. While every room is different, and while every home theater has different sound needs, you can still gauge your area’s acoustic potential by measuring its frequencies. Take care of your saved data, and be liberal with picture comparisons. Your home theater can have near-perfect acoustics, but you’ll need to work for them.